
Thoroughbred Analytics
Transforming Data Into Knowledge
Premium Analysis
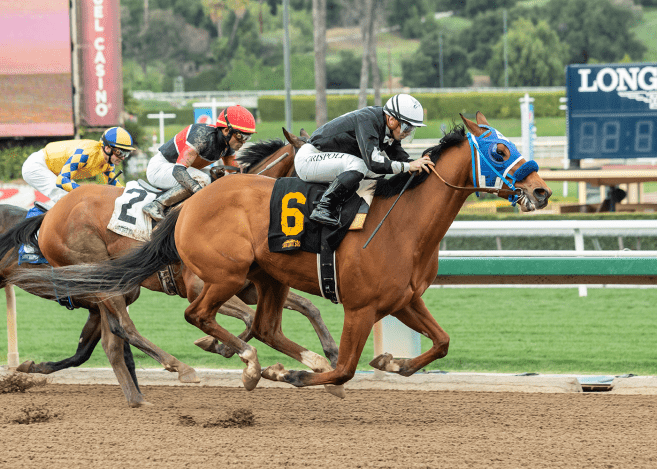
Easily Handicap the Horse Races and Start Winning Like a Pro
A powerful easy to use report that gives you insight into the ability of each horse and how they compare to the rest of the field.

Premium Analysis Available Files
|
SCROLL FOR MORE DATES
| ||||||||
|---|---|---|---|---|---|---|---|---|
| Track | Price | Mon 27th | Tue 28th | Wed 29th | Thu 30th | Fri 31st | Sat 1st | Sun 2nd |
| Assiniboia Downs | $4.00 | - | - | - | - | - | - | |
| Belterra Park | $4.00 | - | - | - | - | |||
| Canterbury Park | $4.00 | - | - | - | - | |||
| Colonial Downs | $4.00 | - | - | - | - | - | ||
| Delaware Park | $4.00 | - | - | - | - | - | - | |
| Del Mar | $4.00 | - | - | - | - | - | - | |
| Ellis Park | $4.00 | - | - | - | - | - | ||
| Evangeline Downs | $4.00 | - | - | - | - | - | - | |
| Fort Erie | $4.00 | - | - | - | - | - | ||
| Finger Lakes | $4.00 | - | - | - | - | |||
| Fairmount Park | $4.00 | - | - | - | - | - | - | |
| Gulfstream Park | $4.00 | - | - | - | - | - | - | |
| Indiana Downs | $4.00 | - | - | - | ||||
| Louisiana Downs | $4.00 | - | - | - | - | |||
| Mountaineer Track & Resort | $4.00 | - | - | - | - | |||
| Penn National | $4.00 | - | - | - | - | |||
| Presque Isle Downs | $4.00 | - | - | - | - | |||
| Prairie Meadows | $4.00 | - | - | - | - | - | ||
| Saratoga | $4.00 | - | - | - | - | - | - | |
| Thistledown | $4.00 | - | - | - | - | |||
An Easy To Use Data Driven Handicapping Report That Will Make You a Winner At the Track
Whether you are new to horse racing, a novice or a seasoned pro the Premium Analysis gives you your best chance at quickly and easily uncovering horses that can win but may have been overlooked by the betting public.
Along with program #'s, post position, and morning line odds the Premium Analysis gives you 3 sets of powerful figures to help guide you with your analysis and betting decisions. The first figure is the TA Indicator which is a single number that indicates how well a horse is expected to perform. This insightful number includes the analysis of over 40 key factors that determine a horse's ability and make it easy to quickly identify potential winners. The second figure is the TA Rank which lists the horse with highest to lowest TA Indicators. The third figure is the TA Ratio which represents a horse's overall relative strength or weakness compared to all other horses entered in the race.
Handicapper's Who Love Premium Analysis
"Thank you so very much for your efforts. What a class outfit!"
Jeff J.
"I have used Thoroughbred Analytics on numerous occasions resulting in a significant ROI."
William S.
When To Use
Easily Make Better Betting Decisions

Quickly identify horses that can win and those to avoid.
About Thoroughbred Analytics
Thoroughbred Analytics is the industry leading provider of data-driven handicapping reports and horse racing statistics for horse racing enthusiasts and professionals, from the beginner to the most advanced. Our reports are produced individually for each race and every thoroughbred track in North America using detailed data and our advanced proprietary handicapping software.